Posts

Showing posts with the label Query Editor

Append v/s Merge in Power BI

Image
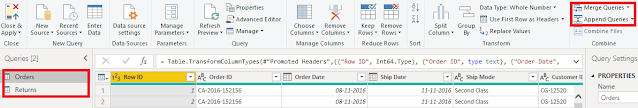
Let's discuss another problem of the week. As a Power BI user, there are times when you want to combine queries. What are the ways to do so? In most cases, you can attain it by using either append or merge and both serve different purposes. Let's understand what do these terms mean in Power BI and how they are functionally different from each other.  It is quite common to get data from various sources and you need to combine those data depending on a particular column which is common in both tables so that you can add extra information or column to your big table. In such cases, we use merge queries. How to perform merge queries? For instance, I am considering Sample Superstore data and we will merge the returns table to the order table. You will find both merge and append in the home tab in extreme right in the power query editor. ProTip - You will find two options when you click on the drop-down in merge which are merge queries and merge queries as new. When you use merge que...

Reference v/s Duplicate in Power BI

Image
Finally, we are back with new blogs. The idea of all the blogs is to share the problem of the week which I faced and provide a solution to it. So, as Business Intelligence Analyst one of my major responsibilities is to design an optimized data model and avoid many to many relationships. The primitive approach to such a problem is to create bridge tables out of a big flat table and create one to many relationships in that process. Creating bridge tables can be achieved in the Power Query Editor. There are mainly two ways to achieve that one is to take reference tables and the other is to create a duplicate table out of the big flat table. So what is the difference between duplicate and reference? Let's dig deeper into it. If you see both of them create a copy of the main table but in duplicate, it will copy the changes applied to the main table whilst in the reference the bridge table will be isolated from all the changes applied to the main table. The reference query always points ...

All about Add columns in Power BI

Image
In today's blog, we will deep dive into the Power query editor. The interface of the power query editor is a replica of an excel spreadsheet but in the former things are much easier as compared to excel. Power query editor offers a lot of features which we have discussed in the guide to power query editor blog .  In this blog, we will focus on one of the features i.e. add columns. You can find it next to the transform tab in the power query editor. We will be working with the sample superstore data. The idea is to explore the add column tab. Let's start with duplicating the column which is just a click away feature available in the power query editor. You just need to select the column of which you need to make a duplicate and select the duplicate column tab available on the top. Unlike in Excel, you need to apply shortcuts to achieve the same. The power query editor is all about making your life easier. From duplicating the columns we will move to index the columns which can b...

Beginners guide to power query editor

Image
Are you spending a big chunk of your time cleaning the data in excel? If yes then this blog is for you. All the cleaning and transforming of data can be achieved in Microsoft Power BI. Power BI offers a wide variety of options to clean your data. Power BI comes with a power query editor where you can play around with the data and I consider it as an ETL tool where you can transform your data according to the needs. We have discussed the data cleaning process in the last blog and in today's blog the focus will be on transforming data and the features that the power query editor offers. These steps are solely subjective according to the data type and to your needs. I am highlighting 6 steps to transforming the data. I am working on the sample superstore data. So let's get started!!!! Removing columns and rows-  We are aware that the datasets can have a lot of unwanted columns and rows. To get better insights you need to get rid of it. To do so you need to select the column. If y...

Creating parameters in Power BI

Image
Let's continue where we left in the last blog. As we are quite familiar with the concept of parameters in Tableau Public ( Creating Parameter in Tableau ). In today's blog, we are going to create parameters in Power BI. Parameter is one of the most used features in Power BI as it saves time and makes the dashboard more dynamic in nature. You can easily create parameters in Power BI just by selecting the transform data and on top of that window you can see "Manage Parameter".  In this blog, the main objective is to see how parameter works and how it can improve the reports. To start off I am taking the Global Sample Superstore data into account. Before using parameters if we select regions and sales together we get a simple bar graph. Along with it if I add states then you can see all the states and their sales in the bar graph. It looks great as a method of representation but if your focus is data visualization then it looks really primitive in nature and not easy to ...