Posts

Showing posts with the label DAX/Measures

Common pitfalls with Values, Distinct and Value

Another week, another blog! This week, we will cover something very basic. If you are a BI developer and work with Power BI, you will be familiar with DAX functions - Values, Value, and Distinct. This blog will cover all the common pitfalls and practical use cases for each of them. Before we start, let's start with a small question. Are distinct and unique means the same? For a very long time, I used to think they were just synonyms, but they aren't. Wait what?? How are they different? Okay, let's understand it. Distinct means each value in a specific column appeared once. In other words, you can say to count all values as 1. If you are a fan of SQL, then you already know that distinct is used to remove duplicates. While unique means you only consider the values that aren't repeated in a column. There's a subtle difference between the 2 that gets ignored easily. Okay, since you are aware of the difference between distinct and unique, we can now start the real acti...

Playing with Totals in Power BI

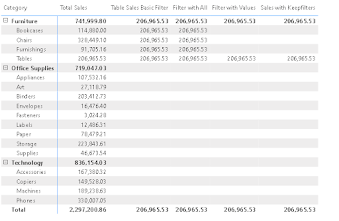
Are you a fan of matrix visual in Power BI? If you are as I am, I always struggle to get the correct totals and get something else instead of the totals it can be average. After a lot of research and going over different community posts, finally we have found 3 common scenarios that can elevate your matrix to the next level. To start with, I am using Sample Superstore data. Let's first explain the 3 different scenarios that we will tackle - We  would like  to show both Total Sales and Average Monthly Sales across different categories and different periods. We  would like  to show the Average Sales in the row subtotals and Total Sales in the column subtotals. Last and the  most interesting scenario is to show the Total sales excluding the furniture sales in the row subtotals and total sales in the column subtotals. Let's start by getting the correct totals in a matrix. Generally, if  use  basic Sum, Average... functions in your measures then most likely...

Highlighting Top 10 with RankX and TopN

Happy Friday!! If you have worked with other BI tools such as Tableau setting up the Top 10 is relatively easy but in Power BI you have dedicated functions such as RankX and Top N to do this. In this blog we will see how to highlight and filter out the TopN Sub Categories based on the Sales recorded in 2013. Before we start. Here are a few pre-requisites we are using Sample Superstore data and we have created an explicit measures called "Total Sales". If you aren't familiar with implicit and explicit measures do read this article . Total Sales is equivalent to Sum of Sales.  We will start with RankX. The goal here is to highlight the Top 10 subcategories based on the Total Sales occurred in the year 2013. Refer to the image below. How to make this? We will start creating a basic DAX which will provide rank to different sub categories. Make sure you provide an order in the DAX itself. In this case we have provided "DESC- descending". Once you have the DAX ready p...

Dealing with blanks in Power BI

Blanks in the dashboards is one of the pain and impacts the user experience. It can occur due to multiple reasons - due to data unavailability which is something is out of control of Power BI developer. One of the best practices suggest to avoid blanks with different approaches in Power BI. In this blog, we will showcase the most common approaches to tackle the blanks. This blog is mainly divided in two parts - dealing with blanks in the KPI cards and dealing with blanks in table or matrix.  Let's start from the KPI cards with the updates dealing with blanks in the cards became very easy. In the new cards it is now possible to provide a separate value when a blank appears in the card. This feature is available under the formatting option of new KPI cards. Do keep in mind this feature is currently available for the new cards.  In the above example we are showcasing the total sales and total sales last year in the reference. Under the highlighted section we can provide the value...

Optimising the Measures with DAX Studio

Another week another blog!! This week we will be focusing on the optimising the bad performing measures and how to tackle the measures generating Call back ID. Before starting, this blog is intended for Users who are a bit familiar with DAX Studio if not then you can do a quick read on our most read blog on our website ( link ). Performance of report is a great factor in improving in the user experience and to check how well your visuals and DAX formulas are performing you can utilise the benefits of Performance Analyser. In my experience Performance analyser along with the DAX Studio is a match made in heaven. You can copy the query from Performance analyser and evaluate in DAX Studio. To know more about how performance analyser works do visit this interesting article ( link ). Let's get our hands dirty and see how you can evaluate your DAX formulas. To do so I have created a basic DAX with help of Filter function  Now, we have included this measure in a table along with the year ...