Do we really need Keepfilters in DAX?
Writing a DAX can be tricky at times and making it efficient for the system is always a challenge for a BI Developer. The most prominent example is the use of filters in DAX. There are zillion ways to filter something in DAX and attain the same result but when you look behind the scenes you will get to know what effect it makes on performance.
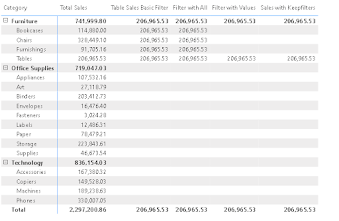
Looking at the above image it all looks the same. In this blog, we will cover the most common scenarios to use filters including the use of filter with all, filter with values, and keepfilters. I am using the sample superstore data for demonstration. The idea is to get sales for "Tables". The DAX is as follows.
The most common and basic approach will be this. Looking at the matrix it gives the sales amount of tables as the total sales for "Furniture". If we use this in a table or matrix results can be perplexing for the user. Considering the total it does make sense. But we want every sub-category to get their respective sales or show blank.
Coming to the second method i.e. use of ALL and filters. What does it actually do? It removes every filter applied to the visual. I am using it with filters and hence we are getting only the Table sales for the whole category. It is a bit similar to the basic filtering.
Someone who has a decent experience in writing DAX always recommends the use of filter and values together. What does it actually do? The use of values removes the duplicates and provides distinct values. The DAX will be similar to the filter with all just replace all with values.
As mentioned in DAX we only sales for table values and will only consider the table as the only subcategory and showcase blanks for other subcategories. DAX experts always suggest either using a filter with values or the use of keepfilters.
The use of keepfilters helps to handle multiple filters without losing any external filters applied. Using it with calculating will help to add additional filter context to the existing setup and doesn't overlook the external filters.
Now we are clear with the DAX let's take a look at the performance of every DAX in DAX Studio. BTS time!! To do so I have connected my Power BI report to DAX Studio and defined the measures there. How to do it? Just right-click on the specific measure and you will get an option to define your measure. We will be publishing a detailed blog on how to use DAX Studio soon.
On line 12 I have included an evaluate function to get the same result as in Power BI. Now we will take a glimpse at the server timings.
The first thing I noticed is using filters generates 2 queries in the background which will affect the load time at the end. Also, the number of rows the DAX scans to give the result. Similarly, I did this exercise with a filter with values and the server timings are as follows.
The number of queries is still the same but the number of rows gets reduced which is a good sign for the performance. Let's see the ultimate result for the keepfilters.
Magic!! the number of queries is reduced to 1. When comparing all of these DAX the first consideration is always the performance and the use of keepfilters turns out to be the most efficient method to get the sales for tables. As a BI developer, you should be aware of the performance of your DAX having said that there is no hard rule to use keepfilters every time it depends on the use case ultimately.
Thanks for Reading Let's connect on LinkedIn. For more such blogs and pro tips do follow us


Comments
Post a Comment