Posts

Showing posts with the label agilebusiness

What is the difference between Related and Lookupvalue in Power BI?

You must be aware of the purpose and significance of Vlookup in Excel. But when it comes to Microsoft Power BI there is no Vlookup in it. Power BI provides you Related and Lookupvalue which is quite similar to Vlookup in Excel. If you aren't familiar with the Vlookup kindly refer to our blog . Let's get started with the purpose of both functions. You will be shocked to know that both of them will give you the same result. Because it follows the same principle of Vlookup i.e. searching for a particular value in a column and returns a value from a different column (different table). In this blog, we will showcase how and when to use related and lookup values. We will be using Sample Superstore data. The question that comes to my mind is when to use the related functions? So there are certain criteria to be met before creating a column with related. One of the conditions is that both the tables (one where we are creating a column and the other will be from where the value will com...

Append v/s Merge in Power BI

Let's discuss another problem of the week. As a Power BI user, there are times when you want to combine queries. What are the ways to do so? In most cases, you can attain it by using either append or merge and both serve different purposes. Let's understand what do these terms mean in Power BI and how they are functionally different from each other.  It is quite common to get data from various sources and you need to combine those data depending on a particular column which is common in both tables so that you can add extra information or column to your big table. In such cases, we use merge queries. How to perform merge queries? For instance, I am considering Sample Superstore data and we will merge the returns table to the order table. You will find both merge and append in the home tab in extreme right in the power query editor. ProTip - You will find two options when you click on the drop-down in merge which are merge queries and merge queries as new. When you use merge que...

Road to data cleaning

Let's consider a scenario where you get the unstructured data and you need to derive the insights using it. This sounds so baffling to me and considering it for data-driven decision-making is one of the mistakes. This scenario can be intervened by a basic step i.e. data cleaning. As the name suggests it is the prior step you need to take before deriving insights and creating visualizations out of it.  In other words, it is a prerequisite for data visualization. In my novice experience, I have handled data that arrived from a variety of sources also entered manually which can escalate the chances of getting duplicate values and wrong values which is needed to be removed before taking it further. All these steps may include eliminating some values or replacing some data so that the data is befitted for further visualization. In today's blog, I will take into account 6 basic steps which prove out to be useful for me in every data cleaning step. All these steps are quite extensivel...

Cohort Analysis

Want to retain your customers then you are at the right place. It can be achieved by Cohort Analysis but the question is how this analysis helps in achieving it. Let's get started by understanding it. Cohort Analysis is used by the analyst to determine the user engagement of customers over time. To be more precise it helps to know whether our user engagement is increasing or decreasing over a period of time. It is done to know the level of user engagement and the customer churning rate in any organization.  In marketing, the cohort is referred to as the group which possesses similar characteristics or traits, and this analysis helps us to divide customers based on their behavior. To get a better understanding of your audience you need to perform such analysis on regular basis. It can be performed in almost every analytical tool mostly organizations prefer Google Analytics but I have done it in Tableau.  This analysis is done in Tableau. Let me walk through it and explain what ...

Agile business intelligence methodology
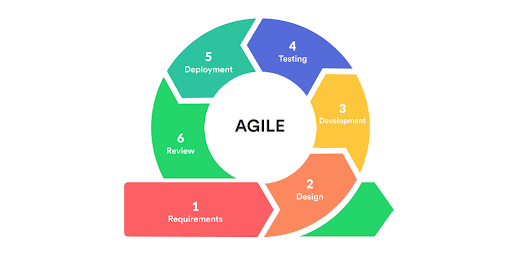
Do you want better control and flexibility in your business operations then this blog has a lot to offer you? All these can be achieved by a simple methodology called agile methodology. So what this uncanny term is? This methodology is used to define the development of software that is used in Business Intelligence and analytical tools. It is also called "Agile business intelligence methodology". Defining the development of software will allow any organization to work in a controlled and flexible manner. The umbrella of agile business has a lot of small sections but the main goal is to help businesses to adapt quickly to the market needs which is continuously evolving. The main advantage of such methodology is that in traditional methodology departments are focused on their tasks and goals and they won't inhibit the work of each other or there is no communication between the departments but this methodology allows that communication which makes the business more flexible ...

Is ms excel a business intelligence tool?

Source Does excel qualify as a Business Intelligence tool? Excel is a spreadsheet tool but it offers features such as graphs, charts, pivot tables, and a programming language called Visual Basics for Application (VBA). What kind of tools are considered BI tools? The primitive answer is the tools that help in collecting data and analyzing it to help in informed decision making. According to this excel qualify as a BI tool. But when you compare excel and other BI tools such as Microsoft Power BI it offers much more than excel. But professionals will argue that excel is always a go-to tool for analysis. If you compare a BI dashboard against the excel final reports you can easily gaze that the latter one is not that intuitive in nature which is a key feature that BI tools offer. Other than that excel reports can do the same work but in today's world, it looks obsolete in nature. BI dashboard is much more interactive in nature. Power BI sample dashboard Sample excel report As a user mys...