
Agile business intelligence methodology

Do you want better control and flexibility in your business operations then this blog has a lot to offer you? All these can be achieved by a simple methodology called agile methodology. So what this uncanny term is? This methodology is used to define the development of software that is used in Business Intelligence and analytical tools. It is also called "Agile business intelligence methodology". Defining the development of software will allow any organization to work in a controlled and flexible manner. The umbrella of agile business has a lot of small sections but the main goal is to help businesses to adapt quickly to the market needs which is continuously evolving.

The main advantage of such methodology is that in traditional methodology departments are focused on their tasks and goals and they won't inhibit the work of each other or there is no communication between the departments but this methodology allows that communication which makes the business more flexible and adaptive in nature. There is a basic structure associated with agile business intelligence-


 Source

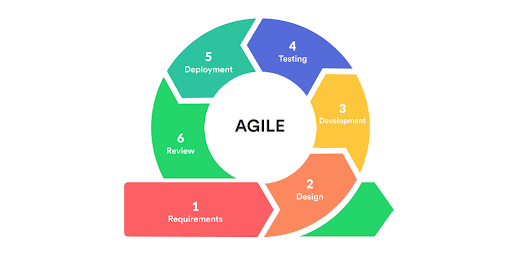
  • Requirements- In this step, you need to focus on the BI capabilities that a decision-maker or end-users is looking for. It needed to be documented and approval is required to proceed further. Approval is generally given by the stakeholders.
  • Design- In this step, you need to take requirements into account and work on the workflow diagrams and various charts to show how this process will reflect in the BI system. It will provide a base for further steps.
  • Development- This step involves the use of various BI tools to build upon the structure or design provided in the second stage. This step will ensure the different functionality and features your BI system will provide.
  • Testing- Subsequent steps will be obvious. Once you build a BI system you need to test it with sample data and create reports to see that the system works well as expected. If not this step should be repeated to ensure that the system should meet the expectations of the end-user.
  • Deployment- Once you find that the BI system is working well according to the requirements it is needed to be deployed in real-time scenarios on a real customer base.
  • Review- After you deployed the BI system in your operations you need to monitor it regularly to analyze the performance, fixing errors if there are any, and at last to get feedback.

These are the steps which are needed to be followed for setting up an agile business intelligence environment. All these steps look very primitive but in practice, every step is vital and requires significant time to be achieved. The BI system should be focused on users and how they are going to use such a system. This methodology always provides any organization a competitive advantage due to its flexibility and a better BI system.


Comments

Popular posts from this blog

Ultimate Beginners Guide to DAX Studio

There are zillions of external tools available with Power BI but DAX Studio is one of the most commonly used tools to work with DAX queries. It is a perfect tool to optimize the DAX and the data model. In this blog let's shed some light on the basic functionalities that can take your report to the next level. ARE YOU READY?  To start you will need the latest version of the DAX Studio. You can download it from their website . Don't worry you don't have to pay for the license. Fortunately, DAX Studio is a free tool As a BI Developer, I am using DAX Studio regularly. Based on my experience I use it for several purposes but in this blog, I will highlight the most common ones. Extracting a dump of all the measures used in your PBIX. Why do we need to do this? It can be used for documentation purposes also sometimes we try to reuse the DAX and such a dump comes in handy in this scenario. How to achieve it? Open the DAX Studio it is located under the external tools once you open t

Append v/s Merge in Power BI

Let's discuss another problem of the week. As a Power BI user, there are times when you want to combine queries. What are the ways to do so? In most cases, you can attain it by using either append or merge and both serve different purposes. Let's understand what do these terms mean in Power BI and how they are functionally different from each other.  It is quite common to get data from various sources and you need to combine those data depending on a particular column which is common in both tables so that you can add extra information or column to your big table. In such cases, we use merge queries. How to perform merge queries? For instance, I am considering Sample Superstore data and we will merge the returns table to the order table. You will find both merge and append in the home tab in extreme right in the power query editor. ProTip - You will find two options when you click on the drop-down in merge which are merge queries and merge queries as new. When you use merge que

Use Relationship in DAX

Data modeling is an essential part of creating perfect visuals. While creating complex data models there can be a case where you can find an inactive relationship represented by dotted lines and it occurs because you already have an active relationship between the two tables. But as a developer, you need to use both the relationship. How can it be done? You can use "Use Relationship" in such cases. Use relationship can be added to your DAX and act as a modifier or enhancer for calculation. It activates the inactive relation. But make sure you have an inactive relationship in place before using the use relationship function. Let's see how it works on Sample Superstore data. In my fact table I have two dates- Order date and Ship date. I am making the two relations between my date table and fact table. The relation between the sample superstore (date) to date table (date) is active while the relation between the sample superstore (ship date) to date table (date) is inactive