
Road to data cleaning

Let's consider a scenario where you get the unstructured data and you need to derive the insights using it. This sounds so baffling to me and considering it for data-driven decision-making is one of the mistakes. This scenario can be intervened by a basic step i.e. data cleaning. As the name suggests it is the prior step you need to take before deriving insights and creating visualizations out of it.  In other words, it is a prerequisite for data visualization.

In my novice experience, I have handled data that arrived from a variety of sources also entered manually which can escalate the chances of getting duplicate values and wrong values which is needed to be removed before taking it further. All these steps may include eliminating some values or replacing some data so that the data is befitted for further visualization.

In today's blog, I will take into account 6 basic steps which prove out to be useful for me in every data cleaning step. All these steps are quite extensively used and can vary depending on the different datasets and what are you trying to achieve from your datasets. 

  • Removing unwanted spaces from your data can be easily achieved by applying TRIM(column_range). I have created a sample text and you can easily spot the difference before and after applying the formula.

  • Getting rid of all missing values can be done by selecting the data range and in the Home tab, you get a tab Find and Select under that select Go to Special and you will get a toggle where you can select blanks and you can see all the blanks are highlighted. Enter any text in one of the cells and press Ctrl+Enter. 


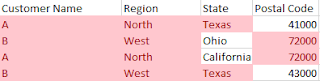
  • Removing and highlighting the duplicated values can be achieved by selecting the data range and go to the conditional formatting tab under that select the highlighted cell rules and select the duplicate values in it. The duplicated data gets highlighted. To delete the duplicated values you need to go to the data ribbon where you can find remove duplicates and it will ask you to select the columns. All the duplicated values get deleted.


  • Using text to columns to get rid of any delimiters or to get customer's first and last names separately. To do so select the data range and go to the data pane and select the text to columns where you will end up in a different toggle where you can see the overview of how your data is going to look like.


  • In contrary to the Text to the column you got the concatenate. To combine the first and last name in a single column this formula comes hefty. Just apply the formula and select both the columns and you will get desired results.


  • Keeping the fonts of your text in mind you need to make sure that you get the befitted fonts whether upper and lower. To do so just apply the formula by selecting the column range and you will get the desired result.


These are some generic steps that I follow almost every time but nowadays you got different tools that are mainly designed to do similar tasks but I prefer all these steps will help you in getting to know your data in a much better way. One of the common questions which I came across is how data cleaning is different from data transformation? The answer lies in the definition where data cleaning is used to eradicate all the unnecessary data while data transformation is used to convert the data from one form to the other. 

As we know mainly all the business intelligence tools have features of data cleaning whether it is a data interpreter or if I may say Power BI query editor where you can almost perform every single task that you can do in excel. So stay tuned for coming blogs where we will get familiar with the basic steps to be performed in the Power BI query editor.


Thanks for Reading  Let's connect on  LinkedIn.


Comments

Popular posts from this blog

Copying Bookmarks from one Power BI report to another

Let's think of a scenario, where you want to copy the bookmarks from one report to another. Most obvious approach is to just do a copy paste of the bookmarks. What's wrong with this approach? This approach only works for all visuals but not for bookmarks and field parameters.  If you are not familiar with basics of bookmarks and field parameters do refer to the beginners guide for bookmarks  and introduction to field parameters . Then how do you copy the bookmarks? Power BI enhanced report format (PBIR) for Power BI Project files (PBIP) will help you in achieving this. Let's check it out, I have 2 reports one contains the bookmark called Bookmarks PBIR Test (origin) and other one is Rolling Average PBIR Test (destination) .  Before we get started, you have to enable Power BI Project save option under preview features. Once enabled, restart Power BI desktop. There is a TMDL icon appearing on the left pane. What is TMDL and what's in it for me? There's a lot of possi...

Playing with Totals in Power BI

Are you a fan of matrix visual in Power BI? If you are as I am, I always struggle to get the correct totals and get something else instead of the totals it can be average. After a lot of research and going over different community posts, finally we have found 3 common scenarios that can elevate your matrix to the next level. To start with, I am using Sample Superstore data. Let's first explain the 3 different scenarios that we will tackle - We  would like  to show both Total Sales and Average Monthly Sales across different categories and different periods. We  would like  to show the Average Sales in the row subtotals and Total Sales in the column subtotals. Last and the  most interesting scenario is to show the Total sales excluding the furniture sales in the row subtotals and total sales in the column subtotals. Let's start by getting the correct totals in a matrix. Generally, if  use  basic Sum, Average... functions in your measures then most likely...

Introduction to Power Ops

Power BI, combined with all external tools, at least the basic ones, can be a perfect BI tool to meet all your needs. Today's blog will focus on another external tool. What?? Not another one!! In my regular practice, I always rely on basic external tools such as DAX Studio, Tabular Editor, and Measure Killer. But what if I say this new tool is a transformer, combining all the basic tools in one place? If you are looking for an introductory guide for the basic external tools, we got you covered.  Beginner's Guide to DAX Studio Advanced Guide to DAX Studio Guide to Measure Killer Yes, you read it right and we will give you an introductory guide to all the functionalities that can be achieved with  Power Ops . Okay, first things first to download Power Ops you can visit their  website  and I would recommend exploring it with one of your reports. You can download the free version. It will be available under the external tools section in Power BI Desktop. Before we move f...