
Append v/s Merge in Power BI

Let's discuss another problem of the week. As a Power BI user, there are times when you want to combine queries. What are the ways to do so? In most cases, you can attain it by using either append or merge and both serve different purposes. Let's understand what do these terms mean in Power BI and how they are functionally different from each other. 

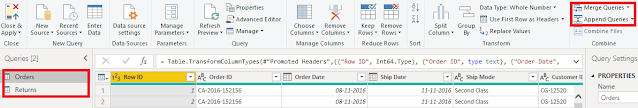
It is quite common to get data from various sources and you need to combine those data depending on a particular column which is common in both tables so that you can add extra information or column to your big table. In such cases, we use merge queries. How to perform merge queries? For instance, I am considering Sample Superstore data and we will merge the returns table to the order table. You will find both merge and append in the home tab in extreme right in the power query editor.


ProTip- You will find two options when you click on the drop-down in merge which are merge queries and merge queries as new. When you use merge queries as new you will make the query dependencies more complex. It's much better to use merge queries.


So, when you select the merge queries option there will be a pop-up box that will open, and there you can select the common columns in both queries and you can also select the type of join you need as you can see in the below picture Power BI offers a lot of options on the type of joins so choose your join wisely.


I am selecting the left outer join for this merge and once you select the ok at the bottom of this pop-up box you will get a column added to the main query which is orders in our case. But you can't see any data in it why this is so? This is mainly because the return query contains two columns and you didn't specify which data needs to be showcased in the orders table. You can do it by clicking on the button which is available at the right in the new column and there you can unselect the order id and you will see only the return status data.


Isn't it easy? Just a matter of a few clicks and you will see the results. Let's do the same for append too. But before that, I created a sample data where one table consist of Customer Name for 2017 and the other table consists of Customer Names for 2018. We will use append in case to combine rows from different tables. You need to make sure that both table contains the same column in the same order. We will append queries and it will lead to a pop-up box where you need to select both the tables.


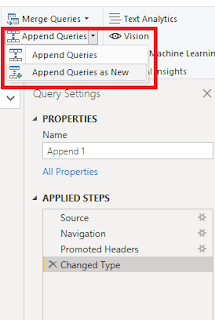
Append 1 is the primary table which contains customer information from 2017 and sheet 1 contains the same information from 2018. You can change the primary table according to your needs. You can see the result in the below picture.


Thanks for Reading  
Let's connect on  LinkedIn. For more such blogs do follow us.


Comments

Popular posts from this blog

Identify and Delete Unused Columns & Measures

Heavy dashboards and a bad data model is a nightmare for every BI Developer. Heavy dashboards can be slow due to multiple reasons. It is always advised to stick with best practices. Are you still figuring out about those best practices then you should definitely have a quick read on Best Practice Analyser ( link ). One of the most common issues with slow dashboards is unused columns and unused measures.  It is very normal to load some extra columns and create some test measures in your dashboard but as a part of cleanup process those unused columns and unused measures should be removed. Why we are removing them? Because if you keep them then ultimately it will increase the size of your data model which is not a good practice.  How to identify the culprits (unused columns and unused measures)? In today's blog we will provide you with 2 most common external tools which will help you in identifying the culprits. More external tools😒. Who's going to pay for this? To your surprise...

Best Practice Analyser (BPA) Guide

Do you want to save tons of efforts to check if your data model and PBIX file follows the standard best practices and norms? Then this blog is for you. If you are a follower of our channel we already deep dive into the importance of the DAX Studio as an external tool. If you are a beginner I would highly recommend to visit this blog . In today's blog we will check how Tabular Editor can help to optimize the data model.  Best Practice Analyser allows to define or import best practices. It will make sure that we do not violate the best practices while developing a dashboard. Isn't it exciting!! Before we start make sure you already have Tabular Editor version 2.24.1 installed on your system. To install it do visit this link and select the link for windows installer. Once Tabular Editor is installed it will reflect in your PBIX file under external tool. Also, we need to define the standard rules. To do so in your advanced scripting or C# script copy this and save it via Ctrl+S. An...

Copying Bookmarks from one Power BI report to another

Let's think of a scenario, where you want to copy the bookmarks from one report to another. Most obvious approach is to just do a copy paste of the bookmarks. What's wrong with this approach? This approach only works for all visuals but not for bookmarks and field parameters.  If you are not familiar with basics of bookmarks and field parameters do refer to the beginners guide for bookmarks  and introduction to field parameters . Then how do you copy the bookmarks? Power BI enhanced report format (PBIR) for Power BI Project files (PBIP) will help you in achieving this. Let's check it out, I have 2 reports one contains the bookmark called Bookmarks PBIR Test (origin) and other one is Rolling Average PBIR Test (destination) .  Before we get started, you have to enable Power BI Project save option under preview features. Once enabled, restart Power BI desktop. There is a TMDL icon appearing on the left pane. What is TMDL and what's in it for me? There's a lot of possi...