
Reference v/s Duplicate in Power BI

Finally, we are back with new blogs. The idea of all the blogs is to share the problem of the week which I faced and provide a solution to it. So, as Business Intelligence Analyst one of my major responsibilities is to design an optimized data model and avoid many to many relationships. The primitive approach to such a problem is to create bridge tables out of a big flat table and create one to many relationships in that process.

Creating bridge tables can be achieved in the Power Query Editor. There are mainly two ways to achieve that one is to take reference tables and the other is to create a duplicate table out of the big flat table. So what is the difference between duplicate and reference? Let's dig deeper into it. If you see both of them create a copy of the main table but in duplicate, it will copy the changes applied to the main table whilst in the reference the bridge table will be isolated from all the changes applied to the main table.

The reference query always points to the main table and does not copy any of the applied steps to the main query. Let's see how does it work in Power BI. I am currently using the Sample Superstore Data. You just need to right-click on the main table and you will see both duplicate and reference.


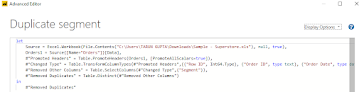
At first, we are creating a reference table out of the orders table and to avoid many to many relationships we will remove duplicates from the segment column. I have removed all other columns because I will set up a segment table and create relationships with other tables.


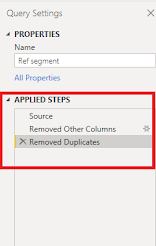
If you do that you will get a column with only three rows. Now let's see the m-script and query dependencies behind this reference. To see that you need to go to the view tab and there you can find both the options.


You can see the process and steps working in the background and it is evident that the reference tables always point to the main table. Now let's do the same thing with duplicates. You will get the duplicate table just following the same steps you just need to select the duplicate instead of reference. Let's see the query dependencies and the m-script for it.


As you can see from the query dependencies when you create a duplicate table it doesn't point out to the main table but if you check the applied steps in duplicate you can see every step that has been applied to the main table is visible over there. 


Duplicate tables require more processing time as compared to the reference tables as it occupies the space in memory. The main question is when to use this duplicate option. You can use this when you want to create a mirror image of the big flat table with all the applied steps. The purpose of both duplicate and reference is quite different and depends on what you want to achieve in the end.


Thanks for Reading  Let's connect on  LinkedIn. For more such blogs do follow us.


Comments

Popular posts from this blog

Identify and Delete Unused Columns & Measures

Heavy dashboards and a bad data model is a nightmare for every BI Developer. Heavy dashboards can be slow due to multiple reasons. It is always advised to stick with best practices. Are you still figuring out about those best practices then you should definitely have a quick read on Best Practice Analyser ( link ). One of the most common issues with slow dashboards is unused columns and unused measures.  It is very normal to load some extra columns and create some test measures in your dashboard but as a part of cleanup process those unused columns and unused measures should be removed. Why we are removing them? Because if you keep them then ultimately it will increase the size of your data model which is not a good practice.  How to identify the culprits (unused columns and unused measures)? In today's blog we will provide you with 2 most common external tools which will help you in identifying the culprits. More external tools😒. Who's going to pay for this? To your surprise...

Copying Bookmarks from one Power BI report to another

Let's think of a scenario, where you want to copy the bookmarks from one report to another. Most obvious approach is to just do a copy paste of the bookmarks. What's wrong with this approach? This approach only works for all visuals but not for bookmarks and field parameters.  If you are not familiar with basics of bookmarks and field parameters do refer to the beginners guide for bookmarks  and introduction to field parameters . Then how do you copy the bookmarks? Power BI enhanced report format (PBIR) for Power BI Project files (PBIP) will help you in achieving this. Let's check it out, I have 2 reports one contains the bookmark called Bookmarks PBIR Test (origin) and other one is Rolling Average PBIR Test (destination) .  Before we get started, you have to enable Power BI Project save option under preview features. Once enabled, restart Power BI desktop. There is a TMDL icon appearing on the left pane. What is TMDL and what's in it for me? There's a lot of possi...

Best Practice Analyser (BPA) Guide

Do you want to save tons of efforts to check if your data model and PBIX file follows the standard best practices and norms? Then this blog is for you. If you are a follower of our channel we already deep dive into the importance of the DAX Studio as an external tool. If you are a beginner I would highly recommend to visit this blog . In today's blog we will check how Tabular Editor can help to optimize the data model.  Best Practice Analyser allows to define or import best practices. It will make sure that we do not violate the best practices while developing a dashboard. Isn't it exciting!! Before we start make sure you already have Tabular Editor version 2.24.1 installed on your system. To install it do visit this link and select the link for windows installer. Once Tabular Editor is installed it will reflect in your PBIX file under external tool. Also, we need to define the standard rules. To do so in your advanced scripting or C# script copy this and save it via Ctrl+S. An...