Posts

Dealing with High Cardinality columns

Are you still struggling with slow reports and a complex data model and you have tried every approach to optimise it? One of the major reason behind your slow reports are high cardinality fields. What is this cardinality now? The simplest definition for it would be the unique values present in a particular column.  Do note we are talking about the unique values not distinct values there is a slight difference between these two. Want to learn more about cardinality here is a great article from Arno. If you have a background in data analysis then the term cardinality may not be alien for you. When we talk about optimising the data model then it is always advised to reduce the cardinality as more the unique values available in a particular column  more it will take the memory and impacts the performance. In this article, we will focus on a few easy steps to reduce the cardinality of the data model. The very fundamental and the simplest step will be to only include the fields tha...

PBIX vs PBIT

As a Power BI user whenever you create a dashboard it saves under a particular extension. Let's imagine if you just started with Power BI then your first priority will be to make dashboards uniform looking. Also, let's suppose if you build a perfect looking dashboard and one of the client requested to make a separate version of it with all the available measures from existing dashboard. How to do it? This article will address all such questions.  Note- This article is only intended for users who just started their Power BI Journey In all such cases your go to option will be PBIT file. Is it same as the PBIX file? When you open PBIT file it looks exactly a replica of the original PBIX but you should focus on the file size. PBIX is comparatively bigger in size than PBIT. Let's understand why this difference exist - When we consider PBIT files it contains all the visuals, data model schema (only the schema), all measures and all the query definitions. One thing or you can say ...

Ultimate Beginners Guide to DAX Studio

There are zillions of external tools available with Power BI but DAX Studio is one of the most commonly used tools to work with DAX queries. It is a perfect tool to optimize the DAX and the data model. In this blog let's shed some light on the basic functionalities that can take your report to the next level. ARE YOU READY?  To start you will need the latest version of the DAX Studio. You can download it from their website . Don't worry you don't have to pay for the license. Fortunately, DAX Studio is a free tool As a BI Developer, I am using DAX Studio regularly. Based on my experience I use it for several purposes but in this blog, I will highlight the most common ones. Extracting a dump of all the measures used in your PBIX. Why do we need to do this? It can be used for documentation purposes also sometimes we try to reuse the DAX and such a dump comes in handy in this scenario. How to achieve it? Open the DAX Studio it is located under the external tools once you open t...

Use Relationship in DAX

Data modeling is an essential part of creating perfect visuals. While creating complex data models there can be a case where you can find an inactive relationship represented by dotted lines and it occurs because you already have an active relationship between the two tables. But as a developer, you need to use both the relationship. How can it be done? You can use "Use Relationship" in such cases. Use relationship can be added to your DAX and act as a modifier or enhancer for calculation. It activates the inactive relation. But make sure you have an inactive relationship in place before using the use relationship function. Let's see how it works on Sample Superstore data. In my fact table I have two dates- Order date and Ship date. I am making the two relations between my date table and fact table. The relation between the sample superstore (date) to date table (date) is active while the relation between the sample superstore (ship date) to date table (date) is inactive ...

New Card Visual in Power BI

A new card with the recent update Power BI has released this visual. This is one of the most awaited visuals by users. Let's take a glimpse of what this new card looks like. Doesn't it look good? In old cards, it is always been a struggle to add an image and sparkline. With the new cards, you can do it just with a click. And the best part is it acts as a single visual so loading time is improved. There are cases where we want to visualize multiple cards and it should be part of a single text box or card. Let's check how to do it? The first step is to create the base measures- Furniture Sales, Office Supplies, and Technology Sales. How to write the DAX using filters? If you aren't familiar with writing DAX do visit our blog . Put all the measures in 3 different cards and fix the alignment. Now we will be introducing a text box with the background if needed.  Alignment needs to be fixed. Once your alignment is fixed select the text box go to format under send backward sel...

Do we really need Keepfilters in DAX?

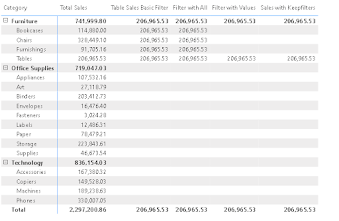
Writing a DAX can be tricky at times and making it efficient for the system is always a challenge for a BI Developer. The most prominent example is the use of filters in DAX. There are zillion ways to filter something in DAX and attain the same result but when you look behind the scenes you will get to know what effect it makes on performance. Looking at the above image it all looks the same. In this blog, we will cover the most common scenarios to use filters including the use of filter with all, filter with values, and keepfilters. I am using the sample superstore data for demonstration. The idea is to get sales for "Tables". The DAX is as follows. The most common and basic approach will be this. Looking at the matrix it gives the sales amount of tables as the total sales for "Furniture". If we use this in a table or matrix results can be perplexing for the user. Considering the total it does make sense. But we want every sub-category to get their respective sales...

Power BI Bookmarks- Beginners Guide

Bookmark you heard it right. Power BI provides a functionality to record the state of your page. It is quite similar to creating bookmarks on your internet browser. The good part is it provides a lot of flexibility for both the developer and the user. In this blog, we will cover how to create a bookmark in Power BI and take it to the next level by using of bookmark navigator. This blog is mainly targeting Power BI users who are at the beginners level. Let's get started with the creation of bookmarks. To do so on the top ribbon you need to select View and under it, you can find bookmarks. It will open a separate pane on the side. Before you create the bookmark make sure all the changes are implemented on the page which you want to see in the bookmark. Once the bookmark is created every change you make on the particular page you need to update the bookmark with the help of the three dots available next to the bookmark. Isn't it easy? Let's take it to the next level. I am usin...

Rolling Totals vs Running Totals

When working with totals in Power BI running totals and rolling totals are the most common ones used to see trends. It can be confusing at times. This article will cover the purpose of both the totals and how you can create DAX for them? Let's start with the running totals. It is quite similar to Year to Date(YTD). What is YTD? YTD covers all the data points from 1st Jan of the respective year till the recent date. We have a separate DAX that is DatesYTD. But what if you want to do the same but from a year in the past.  We want the total sales where the current date is less than or equal to the maximum date. It will cover all data points in the past. In the below-mentioned image you can see values in the last column for 2012 is actually the sum of sales in 2011 and 2012. Isn't it amazing!! Running totals can help you analyze the trends over a long period of time. In the example, we saw the trend from 2011 to 2014. Let's take a deep dive and analyze the trends for the last 3...

Introduction to Slicer Panel

Using slicers is a common practice in Power BI. The positioning and the space it occupies in a dashboard are always in question. I have worked on dashboards where 10-15 slicers are keeping them together on top or side always reduces the space for other visuals. So what can be done? Slicer Panel helps in such scenarios. It is the same as the menu bar on top of different mobile apps. Once you click it expands and shows all the slicers otherwise it collapses and gives you the dashboard for other visuals. In this blog, we will cover how to make a slicer panel step by step. I am considering Sample SuperStore data and I have created a basic dashboard with slicers and other visuals. In the below image, I have put all the slicers on top now we will put all of these slicers into the panel. Protip- As a BI developer I always prefer a drop-down in my slicers because it can be that you have 20 categories or maybe more. I don't want a long list in my slicers. In this dashboard, I will be using...

Wrong Totals in Power BI

Yes, you heard it right Power BI still hasn't figured out how to show the correct totals. One of the most common questions in the Power BI community is related to it. So, let's figure out what can you do to correct your totals. I am using Sample Superstore data to start getting rid of the implicit measures that have already been created. I am creating a matrix with categories and sub-categories. Let's include the total sales, total profit, and the total number of orders received (if you are wondering how these measures are created then it's just the sum of sales, profit, and distinct count of order ID respectively). Protip- One of the best practices involves creating a separate table for measures (stand-alone table). In this case, we only have 5 measures but what if you have 70-80 measures all in the fact table. If you critically note the total for sales and quantity sold shows the correct total but if you sum up the total number of orders for furniture it doesn't ...