Page Level & Object Level Security
Let's explore the realm of security in Power BI. I am a great fan of Power BI as a BI tool that allows to create intuitive visuals with such ease. You can easily share your reports with a large audience across your organization. Let's think of a scenario - your report contains some sensitive data that should not be accessed by all users. Or there are cases where certain reports shouldn't be accessed across different multiple departments. Power BI has answers to all such questions.
Let's start from the very top and understand the different types of security that you can achieve in Power BI - Basic Row Level Security (RLS), Page Level Security (PLS), and Object Level Security (OLS). Row-level security allows to give access based on the defined role. If you are creating a Power BI report this is one of the crucial steps. Check this article from Microsoft to learn about RLS in detail. In this article, we will focus on the Page Level Security and Object Level Security.
Before we begin, we are using our favorite Sample SuperStore data and we will set up PLS based on the different segments. You can download sample superstore data from here. Also, I will be using dummy email addresses.
Let's get our hands dirty! We have 3 segments - Corporate, Consumer, and Home Office. We have 3 users and each of them should only access their segment data. We have to first define which user should be seeing what. Head to the query editor and create a new table. Select enter data and this will open a pop-up tab where we need to fill user's email address, user name, and segment they will be accessing.
Hit close & apply and now we need to head to our data modeling pane. Since your newly created Users table is currently a stand-alone table. We need to connect it with the fact table in this case. In real-life scenarios, it will be your dim table where this Users table needs to be connected. Our key will be segments so ensure in the users table segments name is the same as your fact table.
Protip - We have a many-to-one relationship between the users and the fact table. From experience, I can say it won't be many to one relationship every time. But why? Okay, let's assume I add one more user in the users table, and that user needs access to 2 segments together. This would make your relationship many to many. Always remember that the filter direction should be from your user table towards your fact/dim. Avoid bi-directional filtering as a best practice.
We have created 4 pages - a landing page and 3 different pages for different segments. We need to ensure only the landing page shouldn't be hidden rest of the pages need to be hidden.
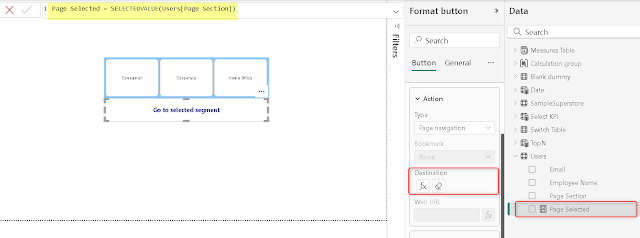
Let's check what we have on the selection page aka landing page. We have mainly 2 things - a button slicer and a blank button leading to different pages. Behind the blank button, we have provided the action for page navigation. To go to the correct page we have created a basic measure with Selected Value. This measure needs to be placed behind the fx in the destination.
Now since our setup is almost ready one of the last steps is to define a role for security. Go to modeling and select manage roles. We will create a very basic role with UserPrincipleName, this will consider the email address of the user and give the access accordingly. The role is defined on the user table. Now is the time for the moment of truth. We will test the role for one user.
Hit OK and you will see on the landing page we only have one segment selected on the button slicer and to access the data the blank button needs to be clicked. When you click the button it will take you to one of the hidden pages in this case it is Consumer. Isn't it amazing???
How cool is this? But wait, there are 2 questions that as a BI developer, you should know. If I introduce this page-level security on my existing report this will change the user experience. Yes, it does change the user experience since this type of security is not a dedicated feature of Power BI, we are taking advantage of the existing features of Power BI to set this up.
Can my PLS be breached anytime? Unfortunately, yes so the ideal scenario will be all users will be coming to your landing page and then head to their respective pages but there can be an instance if a user having access to the Consumer page just shares the link of that page to the user from Corporate. If the link is shared directly, page-level security can easily be breached. What???? Can we fix this? Yes, we can fix this by Object-level security (OLS).
First, we need to understand, what OLS can do. With OLS, we can easily remove a specific column from your table and you can show an error if a user from Corporate tries to access the Consumer page. On the Consumer page, we have Profit as one of the columns in the table and this is sensitive information that can't be accessed by other segments users.
To set it up, we will use the same users table, and this time we need to create another role "Page Block". In this case, I am giving the same user principal name for testing purposes but in ideal scenarios, you just need to define a new role.
Once you have the new role set up, we would need to go to one of our favorite external tools - Tabular Editor. Head to the column, Profit available in your fact table. Under Object-level security we need to provide a default for the new role - Page block and none for the PLS role.
Protip - Giving none for PLS will make that security setup ineffective. But why do we want to do so? If you don't switch to none this would mean both OLS and PLS are effective. As a limitation, you can't use both OLS and PLS together in the same report.
Hit save both in tabular editor and in Power BI and we test this. We have considered users from the Corporate segment.
The ideal scenario will be if this user lands up on the consumer page he/she shouldn't be seeing anything. We are getting a blank table this is what we needed.
In cases, where we need to hide a column from this table it would throw an error such as "specific column can't be found or may not be used in this expression". The moment the user clicks on fix this Power BI is smart enough and it removes the specific column from the table.
Pro tip - If you publish your report in Power BI Service, with both these roles we need to ensure the same set of users shouldn't be available in both roles.
"All our articles are intended to address all the frequently asked questions related to a topic. Do leave a comment if it answers any of your question. "
Thanks for Reading Let's connect on LinkedIn. For more such blogs and pro tips do follow us


Comments
Post a Comment