Introduction to Calculation Groups
Let's consider a scenario where you have 10 fields and the request is to create all-the-time intelligence measures such as MTD, 3M, QTD, and YTD. So as a BI developer in total, you need 40 measures. What??? A long list of measures doesn't look good to me. So can we avoid it? Absolutely yes we can avoid it using calculation groups.
How does calculation group? It is actually available in an external tool called "Tabular Editor". You can download it from here. Let's get our hands dirty. I am creating a table with Category and Total Sales. From time intelligence I need MTD and YTD. You can do it with simple measures but let's try calculation groups.
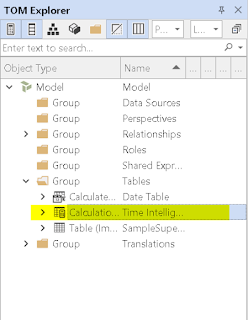
Under external tools, you can find Tabular Editor. Once you open it you can see the tables you are using. To create a calculation group you can right-click on the table and under create you can find the calculation group or you can do the same with the help of the shortcut (Alt+7). I am naming the group Time Intelligence.
There will be different calculation items that are part of a particular calculation group. Right now we only created a calculation group now we will create items. You can do it just by right-clicking the first item will be MTD. For this, the expression will look something like the below image.
Let's understand what we are actually trying to do with this measure. The selected measure can be any measure (in this case it is total sales). When you select MTD it will provide you with the results of MTD sales. Similarly, we did the same with YTD. Just replace the DatesMTD with DatesYTD. Doesn't it look familiar? You are just doing it once for all the measures you have.
Once you created this just save it from the top and refresh your Power BI report. You can see we now have another table named "Time Intelligence". Let's see the fields in this table. We have 2 fields Name and ordinal. The name refers to the calculation item you created in the external tool.
Protip- Ordinal refers to the sorting of your calculation items and generally, this column is hidden.
Let's take a look at how you can use the calculation group in the dashboard. I have a table with sales associated with every category. I have created a slicer that includes the calculation items we created once you select MTD the values in the table get adjusted to MTD values and similarly for YTD. Just to double-check whether we are getting the right results I have created basic DAX for MTD and YTD.
The value in the card is calculated via DAX in Power BI and the value in the table is calculated via the calculation group. The calculation group does work but what if I need to format it using a specific expression. It can be done in Tabular Editor too. We will cover this in future blogs.
Using this can help you to reduce the redundant task of creating measures but also it will affect the performance of the report. One key thing you should keep in mind while using the calculation group is it only works with explicit measures, not with the implicit measures that are already created by Power BI. To know more about explicit and implicit measures you can refer to this link.
Thanks for Reading Let's connect on LinkedIn. For more such blogs and pro tips do follow us


Comments
Post a Comment