
Types of Filters in Power BI

In today's blog, we will take a deep dive into the basic functionality of Power BI. We will talk about the types of filters available in the Power BI whether in the query editor or at the visualization level. Let's start with the purpose of using filters that is limiting the rows on the basis of a condition or restrict the data which you don't want to showcase in your visualization. There are many types of filters available in Power BI. We will start with the filters available in the query editor. I am considering the sample superstore data. So, I have imported the Orders and Returns table and we will be applying the filter on the order date.


When we select the date filters it will lead to a pop-up where you can select basic and advanced filtering currently I am selecting the advanced version. The filter will limit the data for a particular duration as you can see in the image below.

You can remove the filter just by selecting the clear filter. Just to check the code of the filter you can select the column and you can see the code.


There are many options for filters in the query editor we will now move to the visualization filters. There are mainly two filters- visual-level filters and page-level filters. As the name suggests if you apply a filter on the page level then it is applied on all the visualization available on that page whilst at the visual level you can restrict the data on that particular visual.


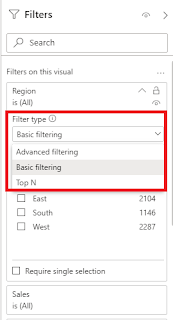
If you select the visual level filters there are 3 types associated with it one is basic filtering, advanced filtering, and top N. Basic filtering just give a simple option to restrict a particular data for example if we put a category in the filter and we only want to showcase furniture then basic filtering is a great option. When it comes to advanced filtering then it is the relative filtering based on a condition like greater than a particular number and top N provides a list of top products/categories (N represents the number).


You can apply basic or advanced filters together for different fields. For instance, we will select only the furniture category also where the profit is greater than 5000 USD and doesn't give blank values.


Now we will consider the include and exclude filters. For that, we will create a bar graph for different regions showcasing their sales. We want to exclude the west region from that graph. To do so right-click on the bar graph and you can see options for include and exclude.


There are many filters other than this but the idea of this blog is just to a gist of filters. But if you google about filters there is a common question how filters are different from a parameter? If you consider the parameter it is mainly applied to the query editor and it is an integral part of query folding so if I apply that particular parameter it will affect the dataset and hence limit the data size at the back end. It will be applied throughout your report, unlike filters which can be either applied on the page level or the visual level.


Thanks for Reading  Let's connect on  LinkedIn. For more such blogs do follow us.


Comments

Popular posts from this blog

Copying Bookmarks from one Power BI report to another

Let's think of a scenario, where you want to copy the bookmarks from one report to another. Most obvious approach is to just do a copy paste of the bookmarks. What's wrong with this approach? This approach only works for all visuals but not for bookmarks and field parameters.  If you are not familiar with basics of bookmarks and field parameters do refer to the beginners guide for bookmarks  and introduction to field parameters . Then how do you copy the bookmarks? Power BI enhanced report format (PBIR) for Power BI Project files (PBIP) will help you in achieving this. Let's check it out, I have 2 reports one contains the bookmark called Bookmarks PBIR Test (origin) and other one is Rolling Average PBIR Test (destination) .  Before we get started, you have to enable Power BI Project save option under preview features. Once enabled, restart Power BI desktop. There is a TMDL icon appearing on the left pane. What is TMDL and what's in it for me? There's a lot of possi...

Playing with Totals in Power BI

Are you a fan of matrix visual in Power BI? If you are as I am, I always struggle to get the correct totals and get something else instead of the totals it can be average. After a lot of research and going over different community posts, finally we have found 3 common scenarios that can elevate your matrix to the next level. To start with, I am using Sample Superstore data. Let's first explain the 3 different scenarios that we will tackle - We  would like  to show both Total Sales and Average Monthly Sales across different categories and different periods. We  would like  to show the Average Sales in the row subtotals and Total Sales in the column subtotals. Last and the  most interesting scenario is to show the Total sales excluding the furniture sales in the row subtotals and total sales in the column subtotals. Let's start by getting the correct totals in a matrix. Generally, if  use  basic Sum, Average... functions in your measures then most likely...

Identify and Delete Unused Columns & Measures

Heavy dashboards and a bad data model is a nightmare for every BI Developer. Heavy dashboards can be slow due to multiple reasons. It is always advised to stick with best practices. Are you still figuring out about those best practices then you should definitely have a quick read on Best Practice Analyser ( link ). One of the most common issues with slow dashboards is unused columns and unused measures.  It is very normal to load some extra columns and create some test measures in your dashboard but as a part of cleanup process those unused columns and unused measures should be removed. Why we are removing them? Because if you keep them then ultimately it will increase the size of your data model which is not a good practice.  How to identify the culprits (unused columns and unused measures)? In today's blog we will provide you with 2 most common external tools which will help you in identifying the culprits. More external tools😒. Who's going to pay for this? To your surprise...