
Calculated column and Measures in Power BI

This blog may seem to be very elementary but I firmly believe it is the foundation of DAX in Power BI. Our nucleus for today is Calculated columns and measures in Power BI. If you are a Power BI user you must have come across these terms. You can find both of them in the home tab (placed next to each other). We will highlight the difference between both of them and the limitations associated with them. Let's get started!!

You can easily increase the table size by adding calculated columns to it and you can provide a DAX or logic for that column. The most pivotal thing we need to be aware of such columns is that they are calculated at the row level. There are situations when you can't create a relationship between tables in such cases calculated columns can come to the rescue. But be aware that the calculated column occupies a space in the memory which can be good or bad in different scenarios. If the DAX for your calculated column is complex then it can provide you a much better experience. If you are totally relying on creating calculated columns over and over then you are increasing your table size and it doesn't fall under the good practices in Power BI.

Let's see how the calculated column works. I am considering the sample superstore data and I will be creating a column name cost which is the difference between the sales and the profit.


You can easily rename the column. One great and key learning which I came across is you can easily apply calculated columns in the page level filters but not the measures. I am creating a table that consists of an Order ID, sales, cost, and profit.


Now I want to see only the Order IDs where the cost is greater than 100 USD and that filter needs to be applied on page level which can be done by calculated column.

What if I don't want to calculate values on row level but I want to see the aggregated values for multiple rows? In such cases, you can use the measures. What do I mean by aggregated values so let's suppose I am writing a DAX for SUM(Orders[Cost]) so it will provide a sum for all the rows that are aggregated under this but if you use the same DAX in the calculated column it will provide you different value based on the row you are referring to. 

One of the interesting and absurd facts about the measures is that you create measures inside the table but still it is not the active part of the table. So if you are looking to establish a relationship between tables with the help of measures then you can't do it. 

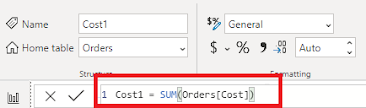
I am creating measures in the orders table which is the sum of the cost. We will be using the same dataset for this and then we will create a card visualization that will showcase the total cost.


Measures are totally dependent on the user interaction in the report which is mainly controlled by the filters and slicers. I would strongly advise using measures when you are looking to calculate ratios and percentages. If your dataset is quite large in size then it's not a good idea to create a calculated column but instead, use measures.


Thanks for Reading  Let's connect on  LinkedIn. For more such blogs do follow us.


Comments

Popular posts from this blog

Copying Bookmarks from one Power BI report to another

Let's think of a scenario, where you want to copy the bookmarks from one report to another. Most obvious approach is to just do a copy paste of the bookmarks. What's wrong with this approach? This approach only works for all visuals but not for bookmarks and field parameters.  If you are not familiar with basics of bookmarks and field parameters do refer to the beginners guide for bookmarks  and introduction to field parameters . Then how do you copy the bookmarks? Power BI enhanced report format (PBIR) for Power BI Project files (PBIP) will help you in achieving this. Let's check it out, I have 2 reports one contains the bookmark called Bookmarks PBIR Test (origin) and other one is Rolling Average PBIR Test (destination) .  Before we get started, you have to enable Power BI Project save option under preview features. Once enabled, restart Power BI desktop. There is a TMDL icon appearing on the left pane. What is TMDL and what's in it for me? There's a lot of possi...

Playing with Totals in Power BI

Are you a fan of matrix visual in Power BI? If you are as I am, I always struggle to get the correct totals and get something else instead of the totals it can be average. After a lot of research and going over different community posts, finally we have found 3 common scenarios that can elevate your matrix to the next level. To start with, I am using Sample Superstore data. Let's first explain the 3 different scenarios that we will tackle - We  would like  to show both Total Sales and Average Monthly Sales across different categories and different periods. We  would like  to show the Average Sales in the row subtotals and Total Sales in the column subtotals. Last and the  most interesting scenario is to show the Total sales excluding the furniture sales in the row subtotals and total sales in the column subtotals. Let's start by getting the correct totals in a matrix. Generally, if  use  basic Sum, Average... functions in your measures then most likely...

Introduction to Power Ops

Power BI, combined with all external tools, at least the basic ones, can be a perfect BI tool to meet all your needs. Today's blog will focus on another external tool. What?? Not another one!! In my regular practice, I always rely on basic external tools such as DAX Studio, Tabular Editor, and Measure Killer. But what if I say this new tool is a transformer, combining all the basic tools in one place? If you are looking for an introductory guide for the basic external tools, we got you covered.  Beginner's Guide to DAX Studio Advanced Guide to DAX Studio Guide to Measure Killer Yes, you read it right and we will give you an introductory guide to all the functionalities that can be achieved with  Power Ops . Okay, first things first to download Power Ops you can visit their  website  and I would recommend exploring it with one of your reports. You can download the free version. It will be available under the external tools section in Power BI Desktop. Before we move f...