SQL Joins

Are you aware of the fundamentals of a Set theory which entails a critical element for our database i.e. the concept of joins? Why do we need Joins in the database? Joins are the fundamental element if you want to combine various tables using a common or related column between them. Joins are mainly used in every analytical and business intelligence tool. 

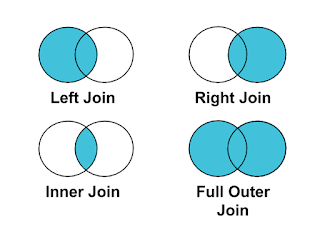
Let's take a deep dive into the fundamentals of joins which is apparent by using a Venn diagram. There are mainly four types of joins- Inner, Left, Right, and Full outer join. Let's suppose we have two datasets A and B. When we focus on inner join it basically means the focus will be on the intersection or common columns present in both datasets. Similarly, the left join focuses on the dataset that is available in A and the common columns between both data sets. Right join is quite identical to left join but the main difference is it takes the data from B along with the common columns present between both data sets. Lastly, full outer join entails the complete data present in both A and B.

Source

This blog will mainly focus on SQL joins because that's the biggest dilemma for beginners where to use which joins when writing a query.  Let's remove the dust from this first we need to get familiar with the syntax query.


SELECT column_name(s)
FROM table1
INNER/OUTER/LEFT/RIGHT JOIN table2
ON table1.column_name = table2.column_name;


To configure it out you need to understand the Venn diagram that is mentioned above. Inner join is used when there is a commonality that exists between your data. Inner join identifies the data which is common and overlapping in nature. It returns the rows of data which has some exact matches. Whilst Outer join on other hand returns all rows including the ones which do not have any match or contains null values. Normally full outer join is not that popular when we consider MySQL database. An outer join will return all the data which is similar to taking a copy of the data in a common table. 

There's a big question which is needed to be addressed when we talk about inner and outer joins i.e. Can we use inner and outer join in the same query? Yes, it is possible to use both in the same query but keeping their order in mind because it can be tricky at times. According to my experience if you use LeftOuter Join before applying an Inner Join then you will get the desired results but it can be false too because it depends on the data and constraints you are working with. I would recommend you to have a look at Jeff Smith Blog. It will provide you greater insight when you are using multiple joins.
Comments

Post a Comment

Popular posts from this blog

Copying Bookmarks from one Power BI report to another

Let's think of a scenario, where you want to copy the bookmarks from one report to another. Most obvious approach is to just do a copy paste of the bookmarks. What's wrong with this approach? This approach only works for all visuals but not for bookmarks and field parameters.  If you are not familiar with basics of bookmarks and field parameters do refer to the beginners guide for bookmarks  and introduction to field parameters . Then how do you copy the bookmarks? Power BI enhanced report format (PBIR) for Power BI Project files (PBIP) will help you in achieving this. Let's check it out, I have 2 reports one contains the bookmark called Bookmarks PBIR Test (origin) and other one is Rolling Average PBIR Test (destination) .  Before we get started, you have to enable Power BI Project save option under preview features. Once enabled, restart Power BI desktop. There is a TMDL icon appearing on the left pane. What is TMDL and what's in it for me? There's a lot of possi...

Playing with Totals in Power BI

Are you a fan of matrix visual in Power BI? If you are as I am, I always struggle to get the correct totals and get something else instead of the totals it can be average. After a lot of research and going over different community posts, finally we have found 3 common scenarios that can elevate your matrix to the next level. To start with, I am using Sample Superstore data. Let's first explain the 3 different scenarios that we will tackle - We  would like  to show both Total Sales and Average Monthly Sales across different categories and different periods. We  would like  to show the Average Sales in the row subtotals and Total Sales in the column subtotals. Last and the  most interesting scenario is to show the Total sales excluding the furniture sales in the row subtotals and total sales in the column subtotals. Let's start by getting the correct totals in a matrix. Generally, if  use  basic Sum, Average... functions in your measures then most likely...

Identify and Delete Unused Columns & Measures

Heavy dashboards and a bad data model is a nightmare for every BI Developer. Heavy dashboards can be slow due to multiple reasons. It is always advised to stick with best practices. Are you still figuring out about those best practices then you should definitely have a quick read on Best Practice Analyser ( link ). One of the most common issues with slow dashboards is unused columns and unused measures.  It is very normal to load some extra columns and create some test measures in your dashboard but as a part of cleanup process those unused columns and unused measures should be removed. Why we are removing them? Because if you keep them then ultimately it will increase the size of your data model which is not a good practice.  How to identify the culprits (unused columns and unused measures)? In today's blog we will provide you with 2 most common external tools which will help you in identifying the culprits. More external tools😒. Who's going to pay for this? To your surprise...