
RFM Segmentation

Source


You must be aware of various customer segmentation techniques and analyses. Let's discuss one of the most important analyses today i.e. RFM Segmentation. What is this 3 letter term can do? The answer is it can do wonders let's get to know more about it. RFM analyses are the method of separating your customers based on RFM scores which will help you in identifying your best customers and lost customers. RFM is an acronym for Recency, Frequency, and Monetary. The main idea behind this analysis is to understand your customers well because it will separate your customers based on how recently your customer made any purchase, how often they are buying, and what is the average cost of their orders.

RFM analyses can be performed in various analytical and programming tools such as Python, R, and Excel. I have done it in Excel on sample data. How to do it in Excel? 

  • Select the right data and insert a pivot table and select the pivot table field accordingly in my case I have selected the product ID, customer ID, profit, and recency.


  • Now we need to obtain the RFM score to categorize the customers for that you need to obtain quartiles of your data set separately for recency, monetary, and frequency for that we will use Quartile.inc($data$range, 0 to 4 )


  • Add columns separately for r score, f score, and m score. These scores can be obtained by nested IFs formula. After obtaining all scores use a simple formula to obtain rfm score i.e. R score*100 + F score *10 + M score*1.
R Score =IF(B4>128;1;IF(AND(B4<=128;B4>82);2;IF(AND(B4<=82;B4>38);3;IF(B4<=38;4))))
Column B represents the recency.


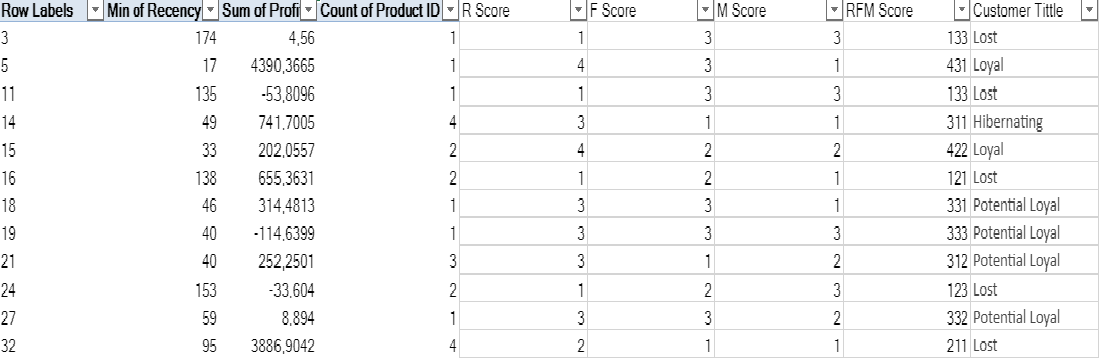
Based on your RFM score you can segregate your customer using nested IFs and quartile.inc. If we consider this analysis it is based on the behavior history of any customer which can change in the future. In that case, you can't totally rely on such analyses for that there are many other advanced customer segmentation techniques that are based on predictive analytics. Also, this analysis is mainly focused on 3 variables (recency, frequency, and monetary) which are vital but there can be other variables in different datasets that should be considered for customer segmentation. Your method can differ depending on your dataset but the idea will remain the same.

Overall such analysis is highly data-driven in nature and allows us to make informed decisions. Strategies can be made by focusing on different groups which will help any organization to improve the customer retention rate and engagement rate. 

Thanks for Reading  Let's connect on  LinkedIn


Comments

Popular posts from this blog

Copying Bookmarks from one Power BI report to another

Let's think of a scenario, where you want to copy the bookmarks from one report to another. Most obvious approach is to just do a copy paste of the bookmarks. What's wrong with this approach? This approach only works for all visuals but not for bookmarks and field parameters.  If you are not familiar with basics of bookmarks and field parameters do refer to the beginners guide for bookmarks  and introduction to field parameters . Then how do you copy the bookmarks? Power BI enhanced report format (PBIR) for Power BI Project files (PBIP) will help you in achieving this. Let's check it out, I have 2 reports one contains the bookmark called Bookmarks PBIR Test (origin) and other one is Rolling Average PBIR Test (destination) .  Before we get started, you have to enable Power BI Project save option under preview features. Once enabled, restart Power BI desktop. There is a TMDL icon appearing on the left pane. What is TMDL and what's in it for me? There's a lot of possi...

Playing with Totals in Power BI

Are you a fan of matrix visual in Power BI? If you are as I am, I always struggle to get the correct totals and get something else instead of the totals it can be average. After a lot of research and going over different community posts, finally we have found 3 common scenarios that can elevate your matrix to the next level. To start with, I am using Sample Superstore data. Let's first explain the 3 different scenarios that we will tackle - We  would like  to show both Total Sales and Average Monthly Sales across different categories and different periods. We  would like  to show the Average Sales in the row subtotals and Total Sales in the column subtotals. Last and the  most interesting scenario is to show the Total sales excluding the furniture sales in the row subtotals and total sales in the column subtotals. Let's start by getting the correct totals in a matrix. Generally, if  use  basic Sum, Average... functions in your measures then most likely...

Introduction to Power Ops

Power BI, combined with all external tools, at least the basic ones, can be a perfect BI tool to meet all your needs. Today's blog will focus on another external tool. What?? Not another one!! In my regular practice, I always rely on basic external tools such as DAX Studio, Tabular Editor, and Measure Killer. But what if I say this new tool is a transformer, combining all the basic tools in one place? If you are looking for an introductory guide for the basic external tools, we got you covered.  Beginner's Guide to DAX Studio Advanced Guide to DAX Studio Guide to Measure Killer Yes, you read it right and we will give you an introductory guide to all the functionalities that can be achieved with  Power Ops . Okay, first things first to download Power Ops you can visit their  website  and I would recommend exploring it with one of your reports. You can download the free version. It will be available under the external tools section in Power BI Desktop. Before we move f...