Market Basket Analysis
Have you been to the supermarket and have you realized when you get a combo offer (milk and cheese) on various products. What sort of analysis can help the retailers to decide which combination will yield the maximum profit? Here comes the role of Market Basket Analysis. Let's make it clear what this sort of analysis does. It is the analysis that helps in identifying the relationships between two events that take place together. To dust it off just visit your amazon account and if you want to buy a mobile phone you can see there several suggested items which are tagged together with the phone.
It's an absolute case of If you buy 'A' Then you are likely to buy 'B'. It plays a pivotal role in devising pricing strategies and also helps in implementing cross-selling. How supermarket uses it? Supermarkets have recorded datasets about the purchases that an individual makes. According to this dataset, they identify the products that are purchased together for example if you are taking bread it's more likely you will buy butter too. In this blog, we will perform market basket analysis with sample superstore data in Tableau so stay tuned.
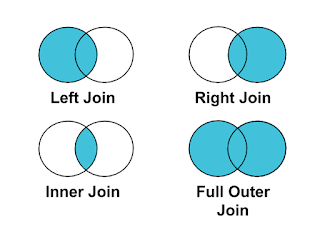
In order to do it, you need to focus on your order table. We will join the order table with the order table yes it can be done by dragging the order table and setting a join between them taking order id and subcategory as the common entity between the two. We will drag subcategories from the first order table in columns and the other subcategory from the second order table in rows. You can observe a look-alike of a correlation matrix in excel. We will drag the order id from the first orders table in the label and also in the colors.


Comments
Post a Comment